Evolution Analysis
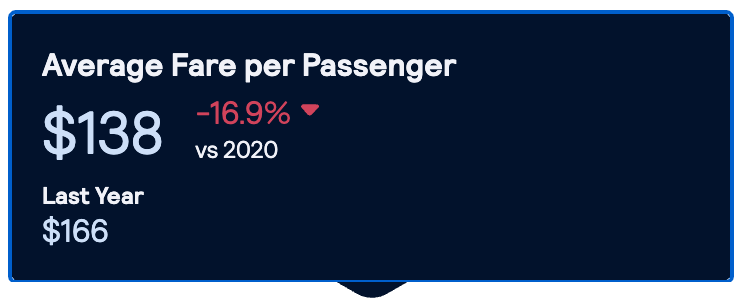
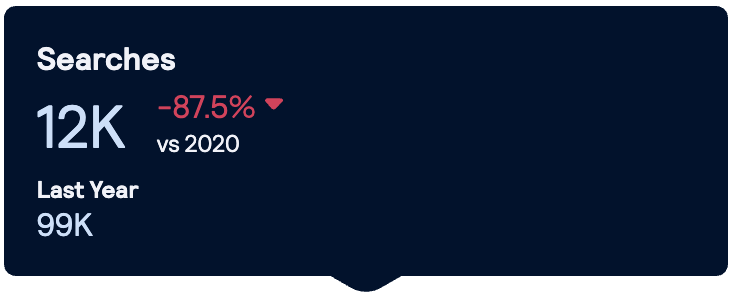
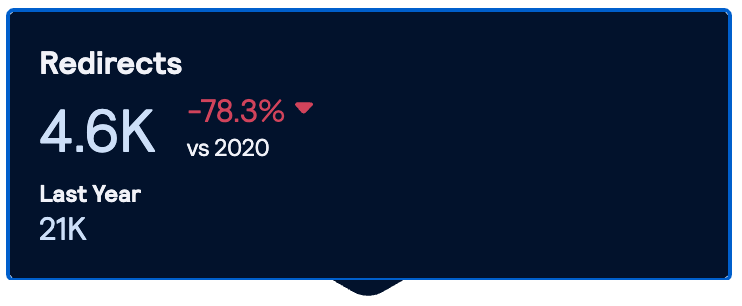
In the Competition Analysis module, the Evolution analysis shows YoY evolution of Key Metrics such as Average Fare Per Passenger, Searches and Redirects based on the routes and travel months selected.
Each Key Metric box is dynamic and, if clicked, updates corresponding graphs for the selected metric.
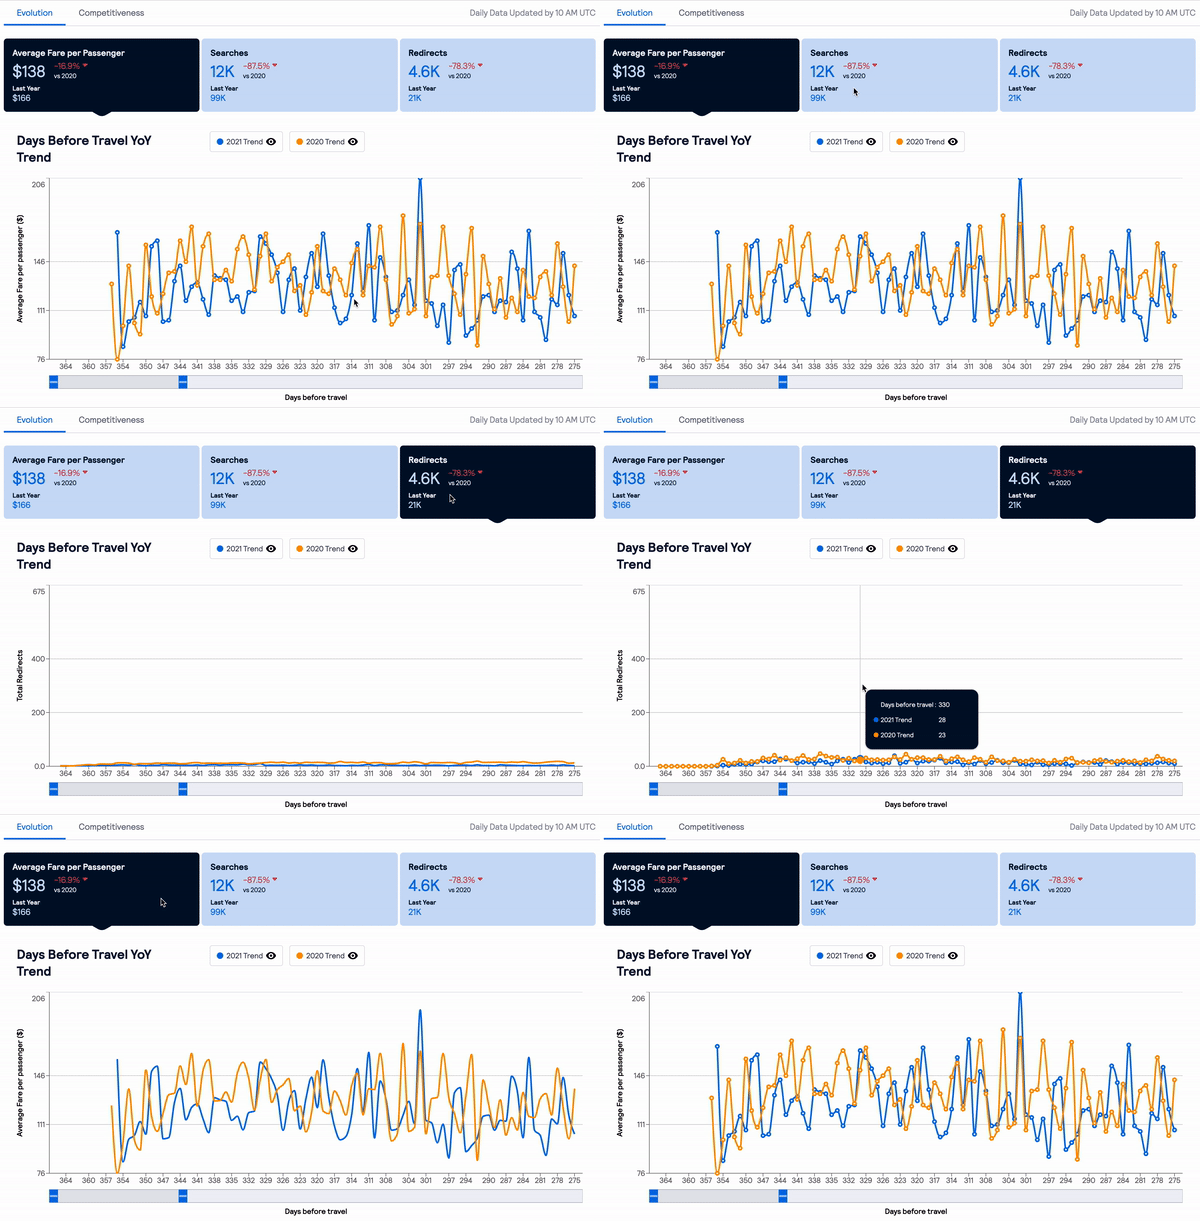
Exploring Key Metrics
Average fare per passenger
|
 |
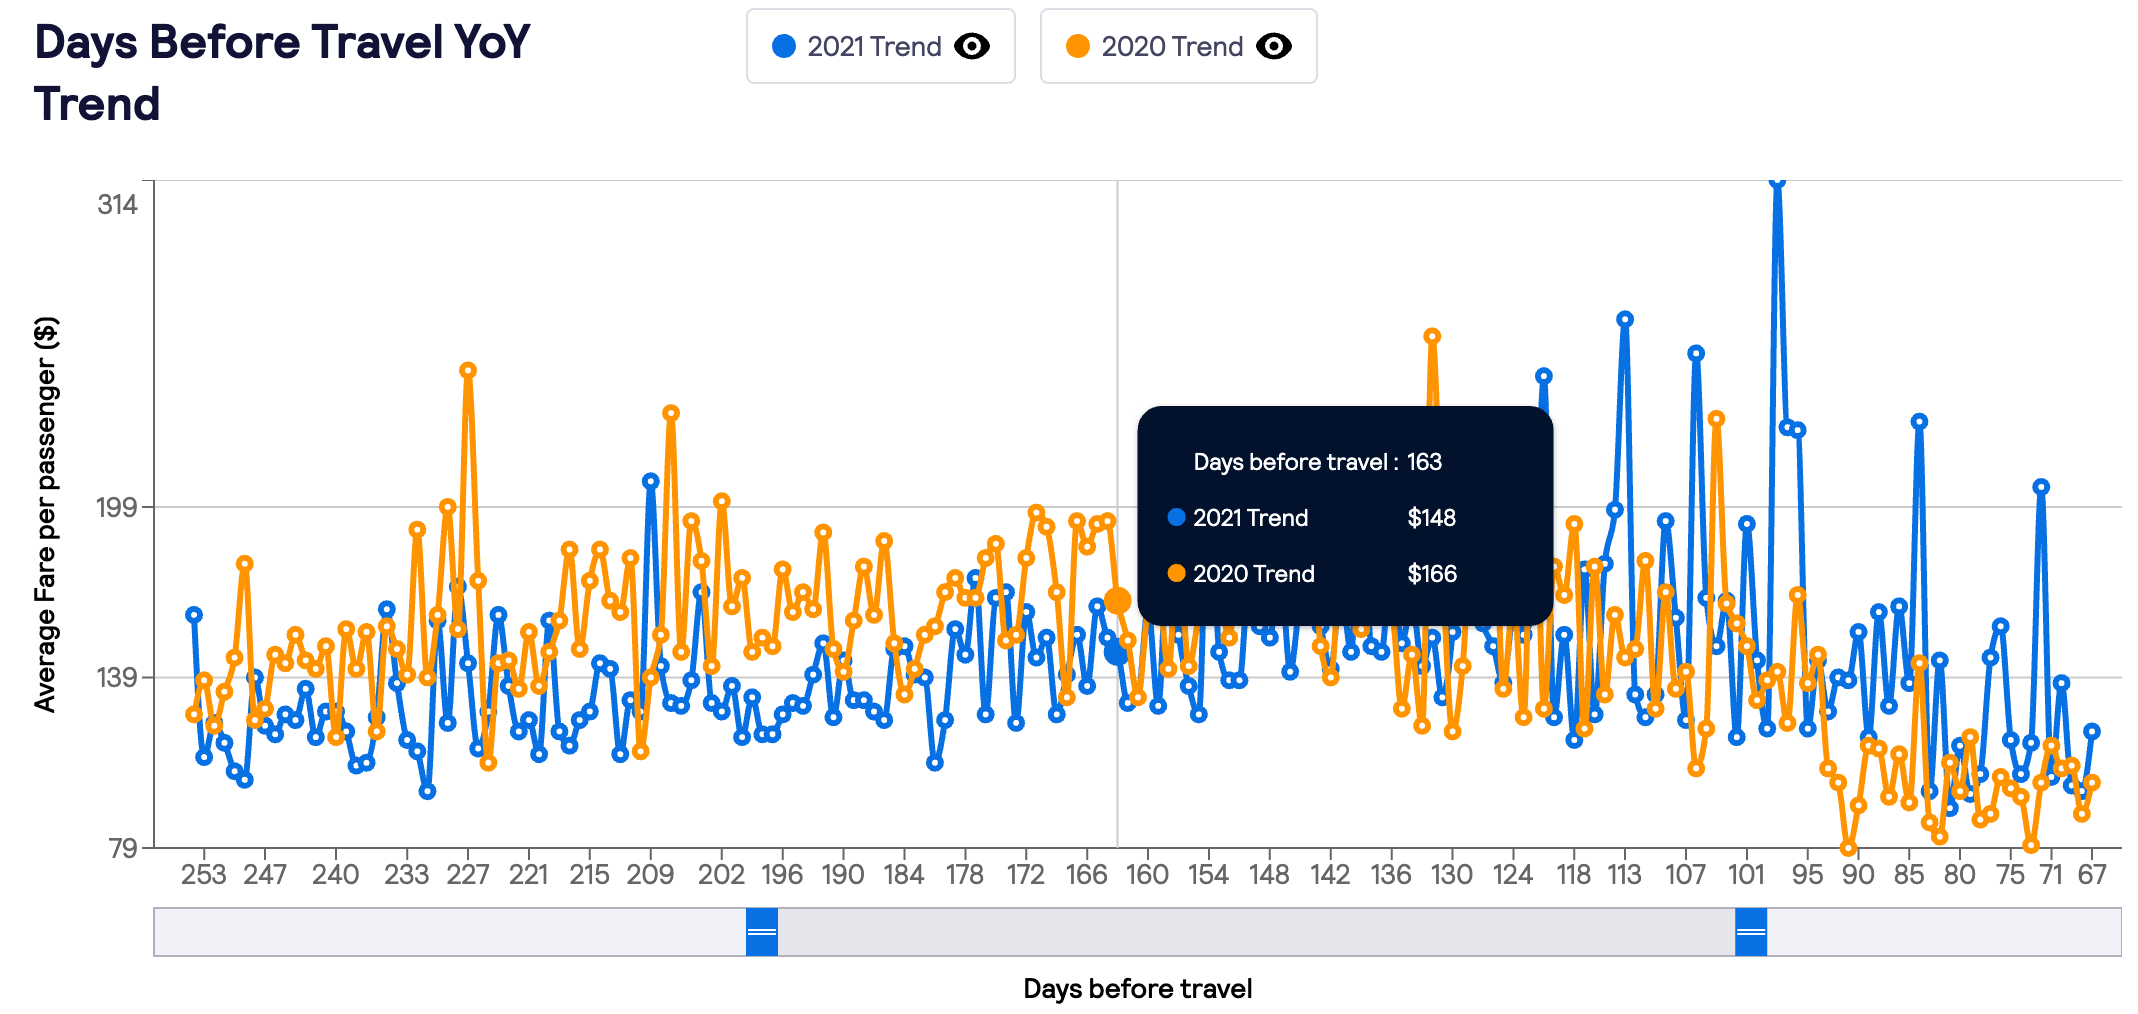
Days Before Travel YoY Trend Graph
- The Days before Travel Trend shows the average fare trend and a lead time to departure by calculating the number of days from the search date to the travel date.
- Adjust the 'days before travel' trend frame by using the sliding scale.
- When hovered over a single graph's datapoint, a tooltip shows the exact value of days before travel, this year's average fare per passenger value in USD and the same for the year before.
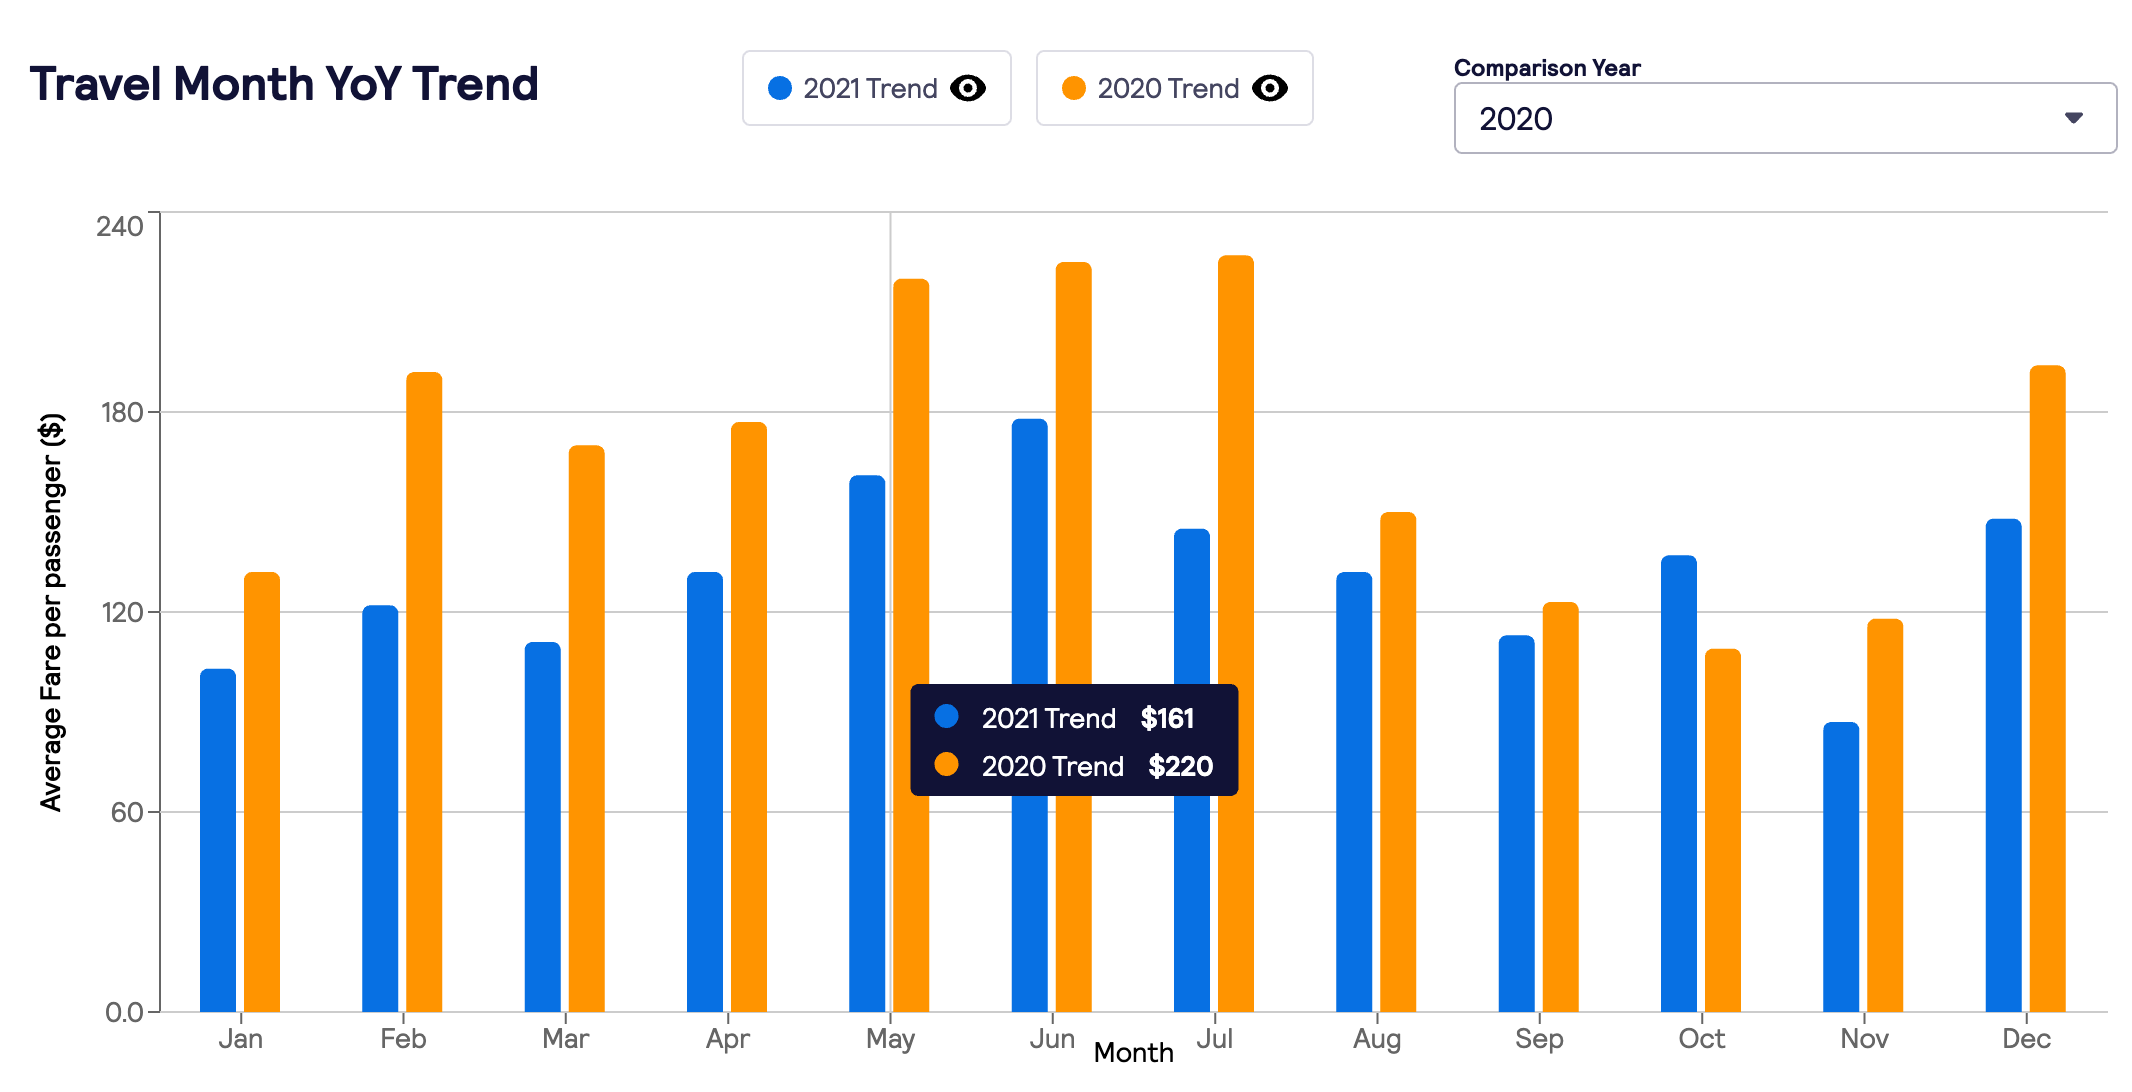
Travel Month YoY Trend Graph
- Displays the average fare per passenger trend by travel months this year vs last year.
- Data is based on travellers' redirects made in the last 12 months for this year's performance and between 24 and 12 months back for the last year's performance.
- The graph shows calendar year months: Jan to Dec.
- When hovered over a single graph's datapoint, a tooltip shows the exact value of this year's average fare per passenger in USD and the same for the year before.
Please note that a change in Travel month search filter will not change data on this graph.
Searches
|
 |
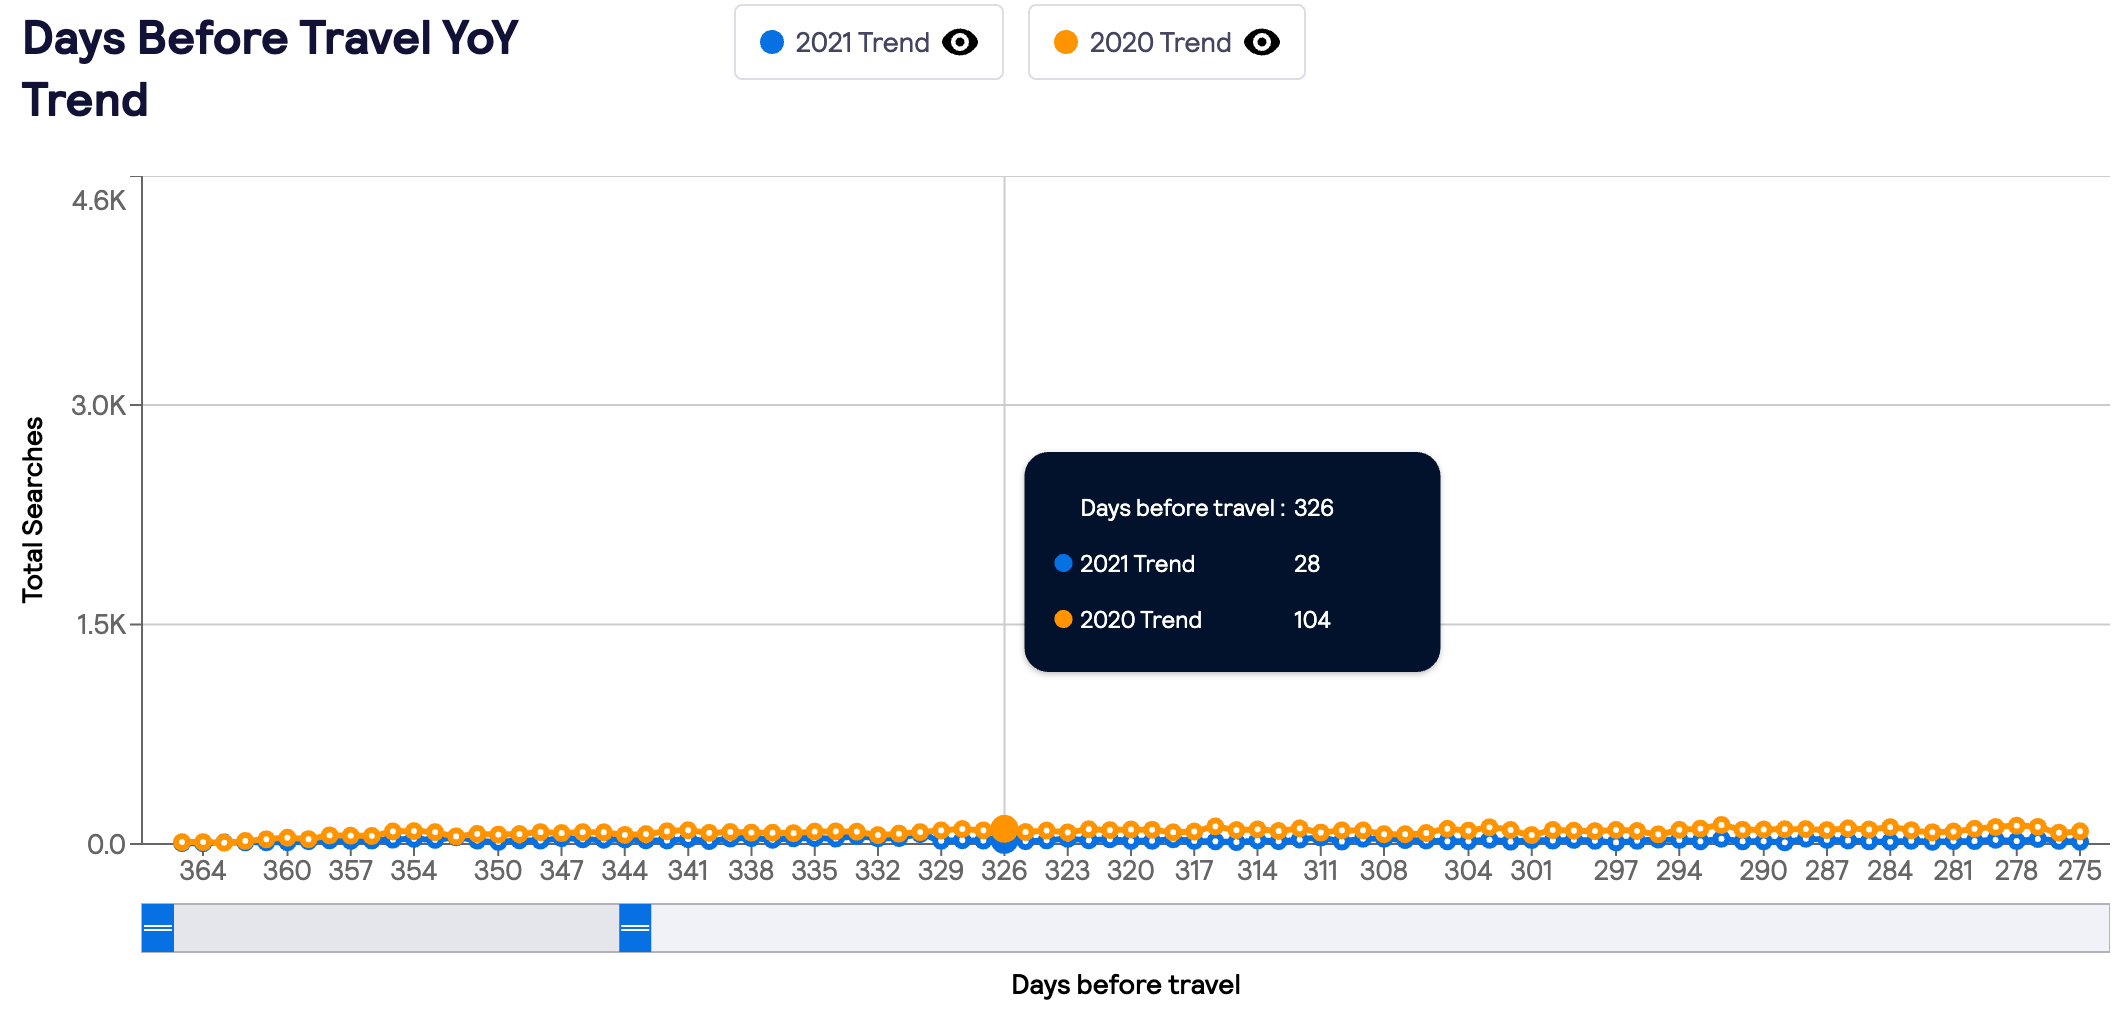
Days Before Travel YoY Trend Graph:
- The Days before Travel Trend shows the searches demand curve and a lead time to departure by calculating the number of days from search date to travel date.
- Adjust the 'days before travel' trend frame by using the sliding scale.
- When hovered over a single graph's datapoint, a tooltip shows the exact value of days before travel, this year's searches volume and the same for the year before.
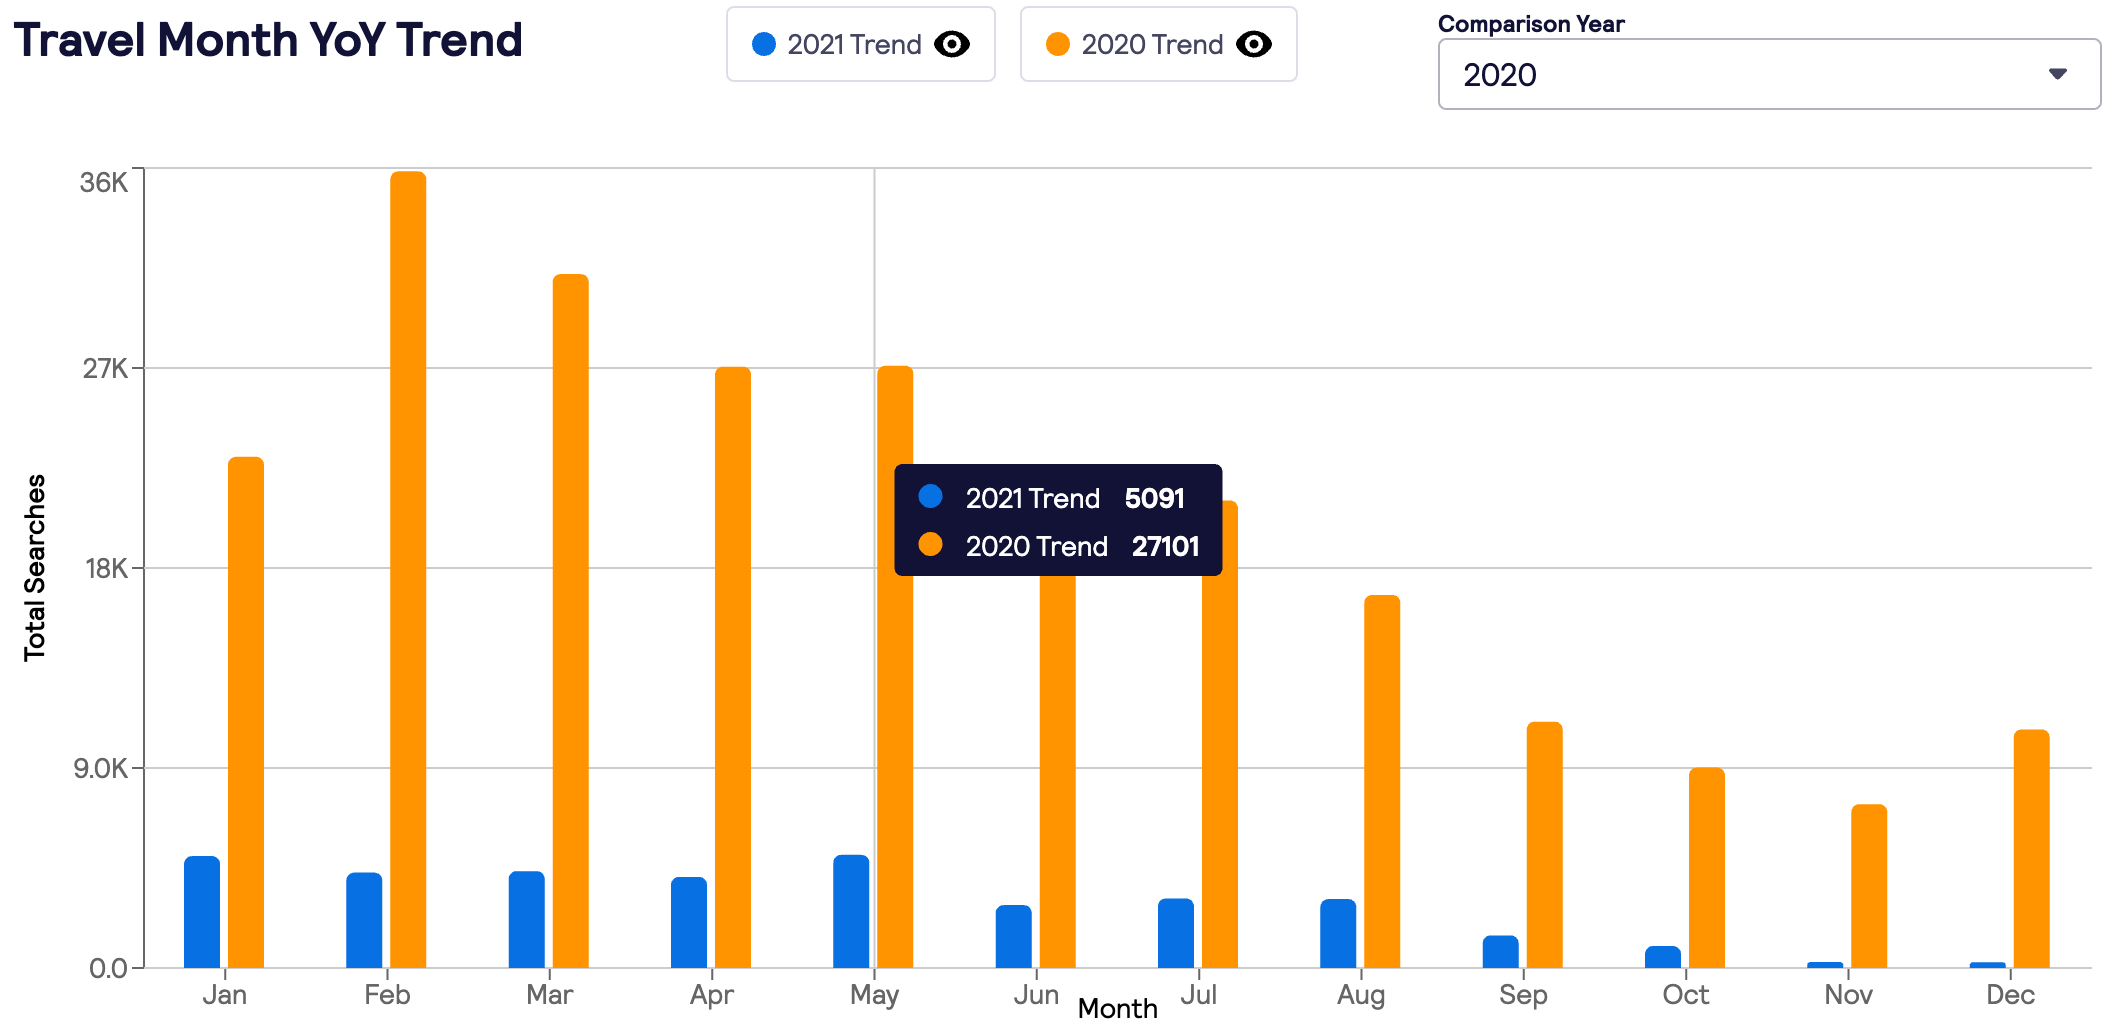
Travel Month YoY Trend Graph:
- Total searches trend by travel months this year vs last year.
- Data is based on travellers' searches made in the last 12 months for this year's performance and between 24 and 12 months back for the last year's performance.
- The graph shows calendar year months: Jan to Dec.
- When hovered over a single graph's datapoint, a tooltip shows the exact value of this year's total searches and the same for the year before.
Please note that a change in Travel month search filter will not change data on this graph.
Redirects
|
 |
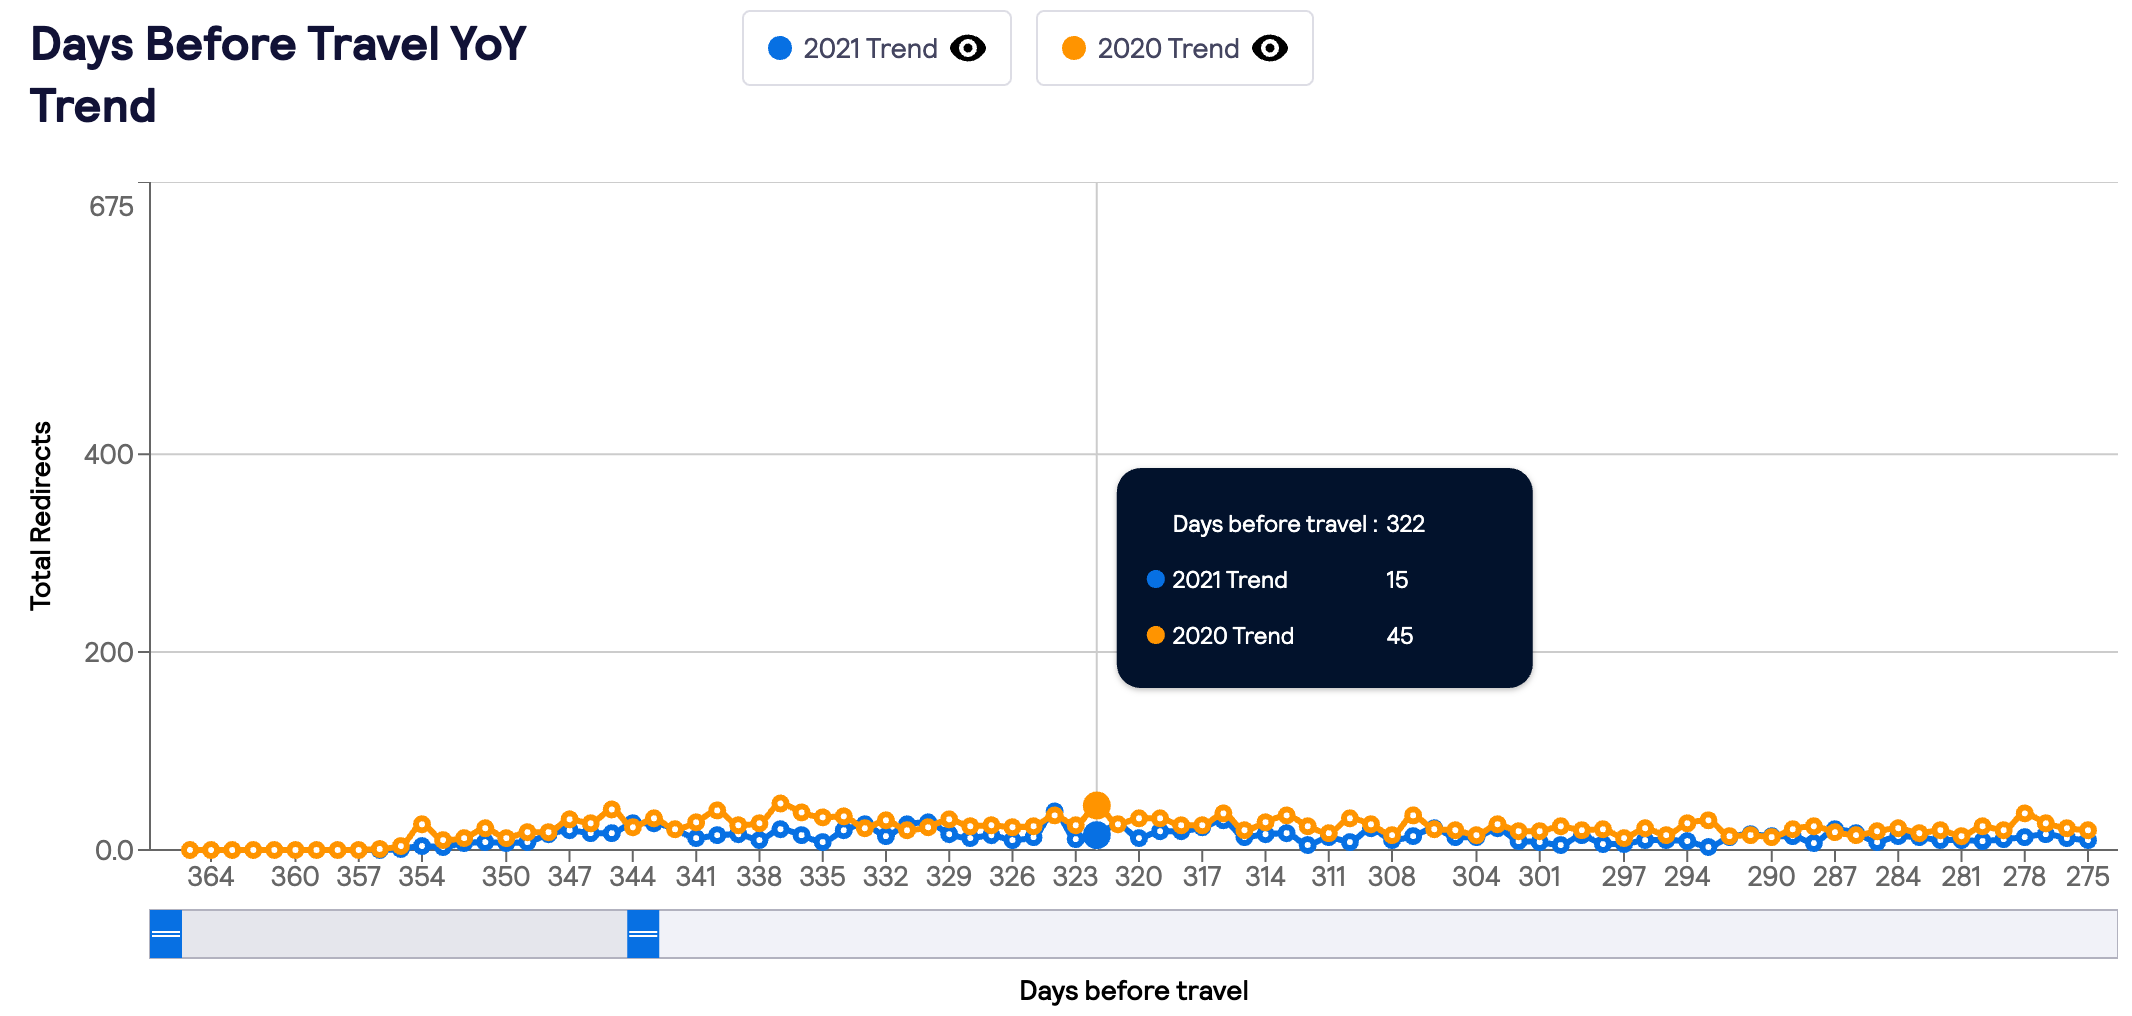
Days Before Travel YoY Trend Graph:
- The Days before Travel Trend shows the redirects demand curve and a lead time to departure by calculating the number of days from search date to travel date.
- Adjust the 'days before travel' trend frame by using the sliding scale.
- When hovered over a single graph's datapoint, a tooltip shows the exact value of days before travel, this year's redirects volume and the same for the year before.
Travel Month YoY Trend Graph:
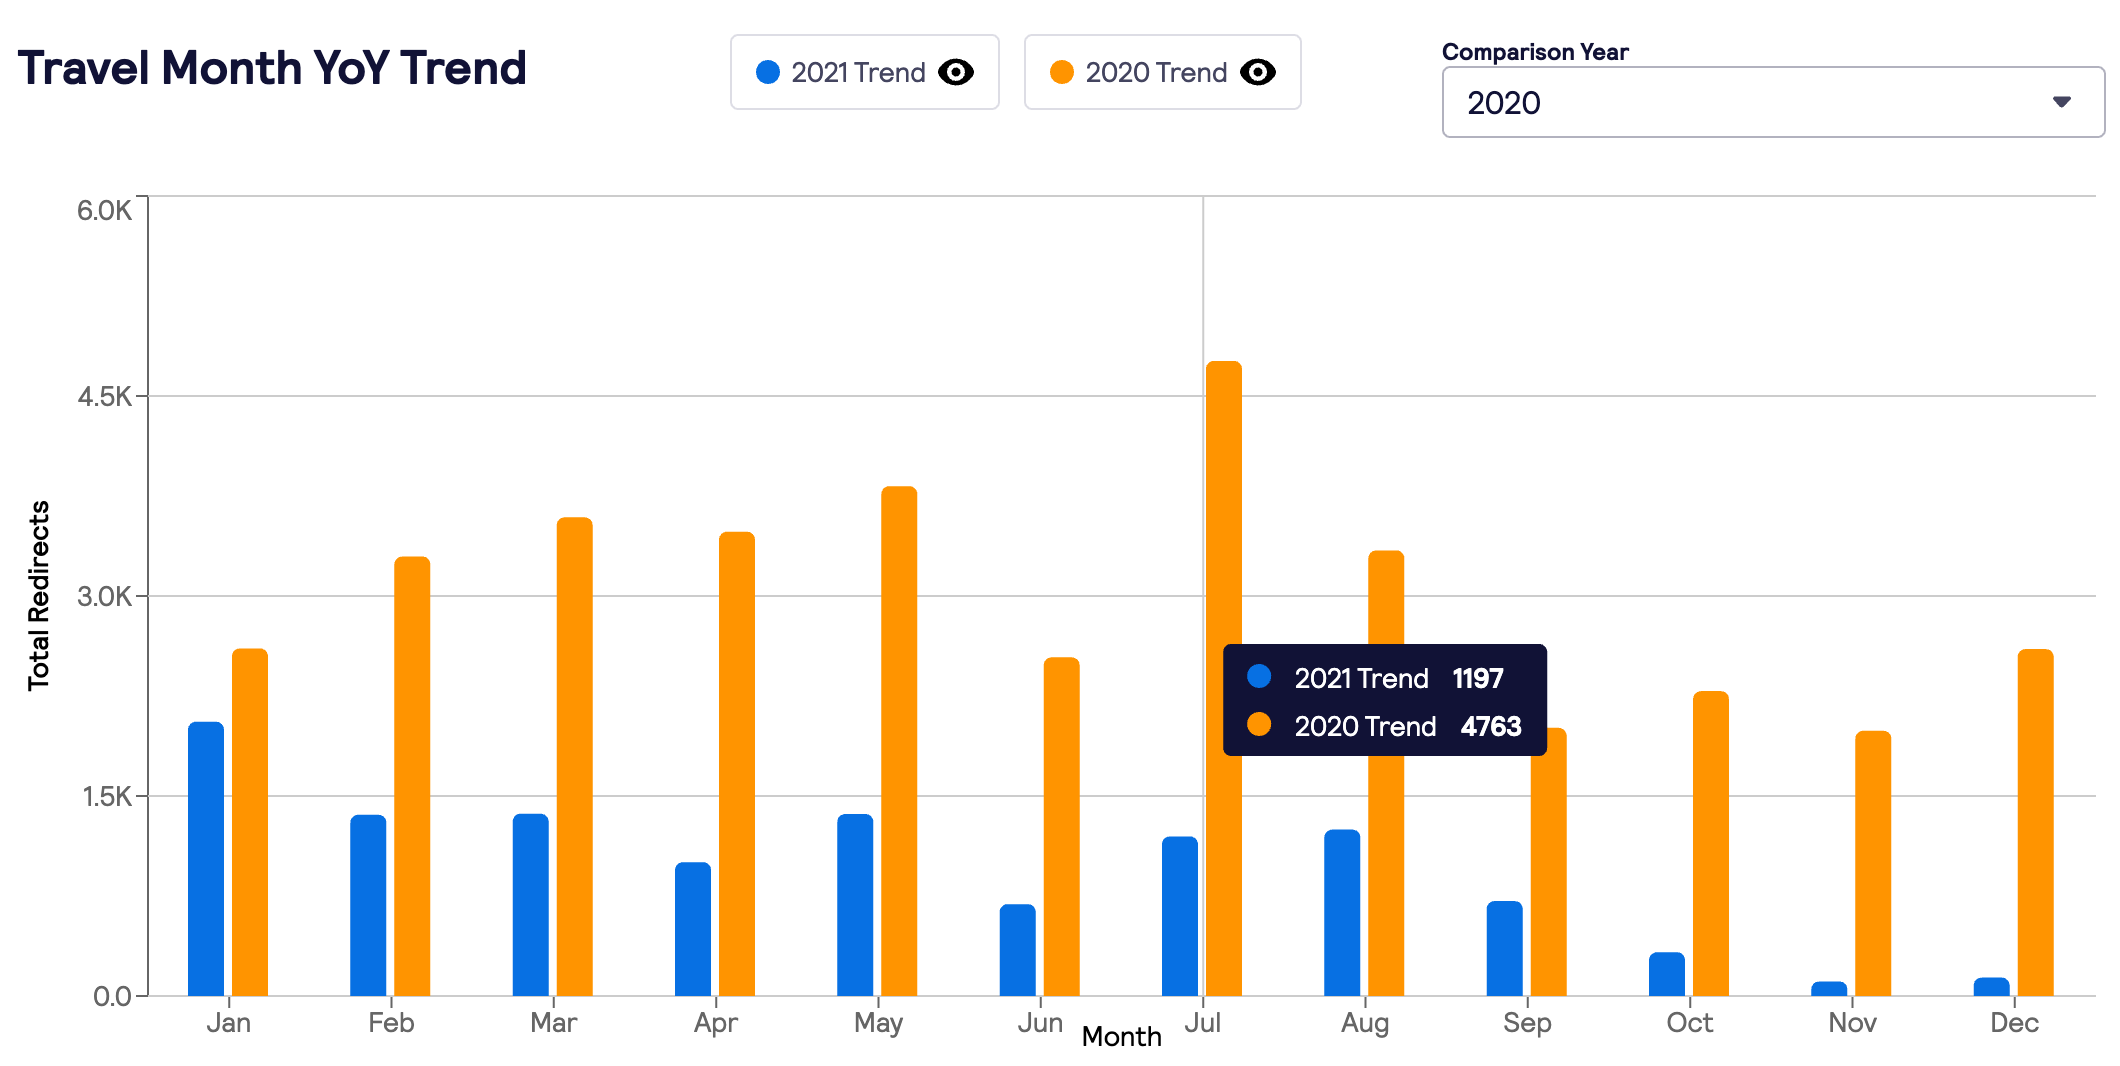
- Total redirects trend by travel months this year vs last year.
- Data is based on travellers' redirects made in the last 12 months for this year's performance and between 24 and 12 months back for the last year's performance.
- The graph shows calendar year months: Jan to Dec.
- When hovered over a single graph's datapoint, a tooltip shows the exact value of this year's total redirects and the same for the year before.
Please note that a change in Travel month search filter will not change data on this graph.
Export
| Both Evolution and Competitiveness modules can be exported in .xls format. |  |
