Network Market Share Module
This module by default provides insight into how airline market share has been changing over the last 12 months in given markets and enables users to filter this data down to specific travel months, routes and other trip parameters. The data includes historical years for both Search and Travel months. The market share is defined as a percentage of clicks that a specific airline received on Skyscanner.
Using the filters

Market
This filter represents the Skyscanner user's country they've selected when using the Skyscanner website or app.
- By default, all markets are selected, however, the filter may restrict the number of markets shown based on a partner's subscription set-up. The total market count will appear in the drop-down.
- Markets are displayed by Region > Country.
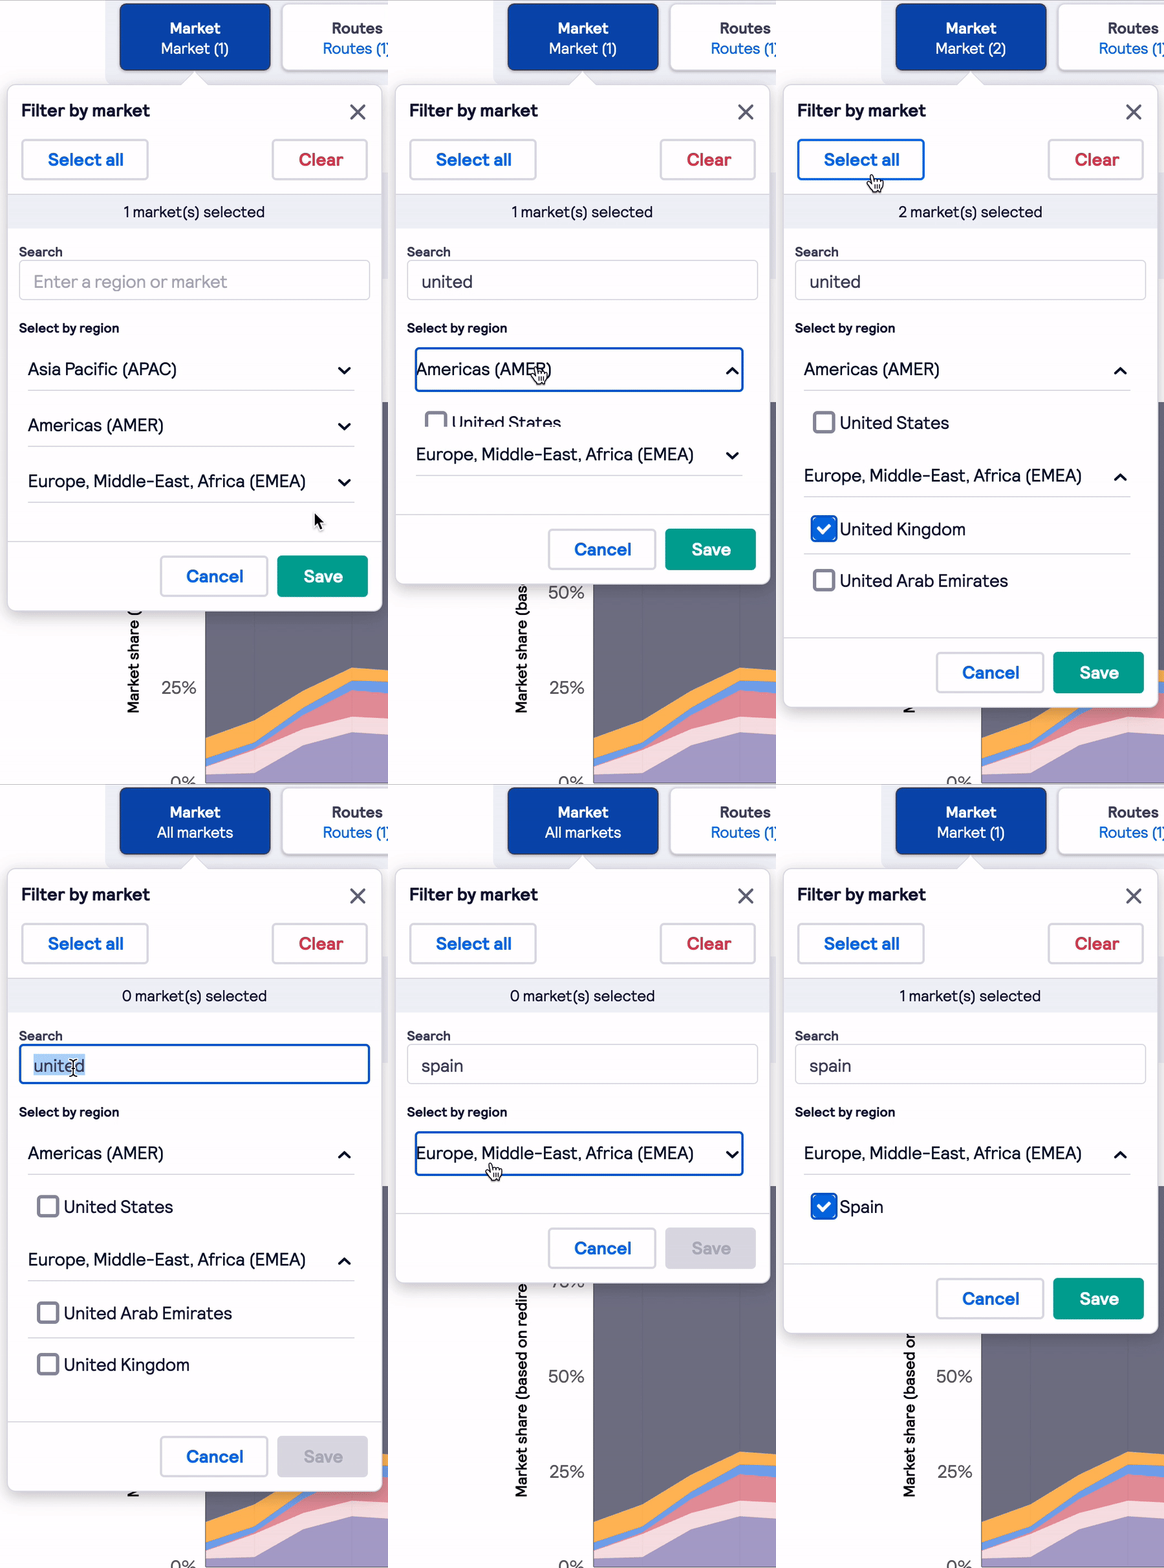
- There are multiple ways to search, select and deselect markets:
- Enter a country, or region name into the search field.
- Click on a region to expand the list of countries then select or deselect your choices.
- Clicking the Clear button will uncheck all selections.
- Clicking the Select all button will check all countries.
- Clicking the X-close icon or Close button will close the Market filter and changes will be applied.
- Click the Close button to save your changes. Please note changes will not be applied until the Apply button is clicked in the filters menu.
|
|
 |
Routes
Easily select routes based on origin and destination.
-
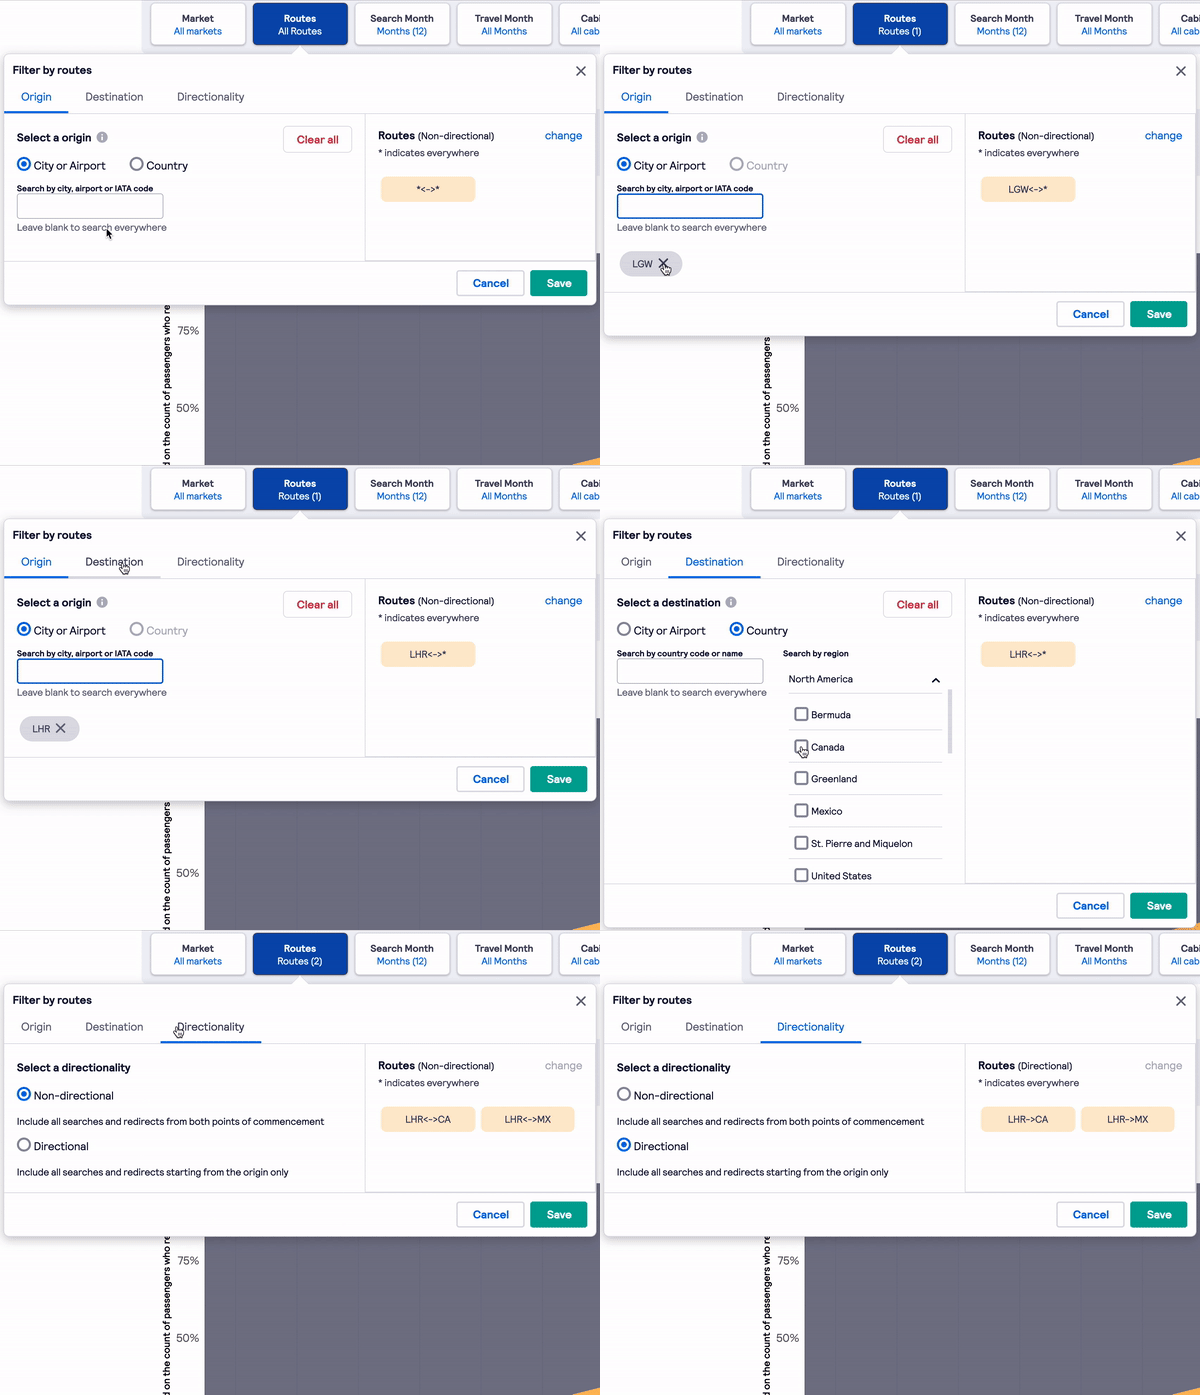
There are multiple ways to search, select, and deselect origins and destinations:
-
Enter an origin or destination into the text field. This can be a city or airport name or IATA code.
-
Search for a country by clicking the country radio button and entering the country name into the text field.
-
You can also find a country by using the dropdown country list.
-
Clear selections by clicking on the individual route indicator which appears when you've selected an origin or destination or by clicking the Clear all button.
-
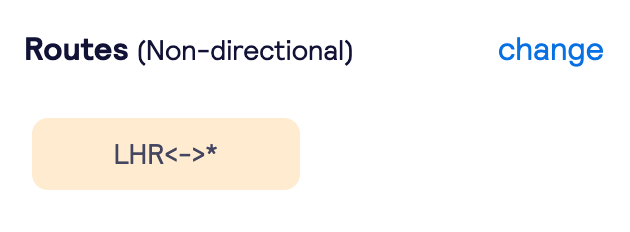
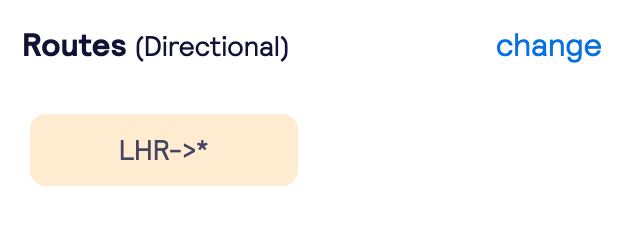
Selections are limited to 5 origins and 5 destinations. However, a wildcard search is supported, e.g. LHR →*, i.e. London Heathrow to any airport. Make a wildcard search by simply entering only the origin or destination airport.
-
Once origins and destinations are selected, the Routes section on the right of the filter will summarise your choices and display all possible combinations.
Directionality
Directionality allows you to analyse data between directional and non-directional routes. By default, the module shows the analysis for non-directionality.
Select directionality by clicking the directionality tab or 'change' link in the routes section of the filter, then switch between the two options.
Your choice of directionality will then be applied to all of your route selections.
What is Non-Directional and Directional-based volume?
Non-directional air traffic is when we calculate traveller demand in two streams that flow in opposite directions. For example, if a traveller searches for a return flight from Valencia to Edinburgh, they’re counted once from Valencia to Edinburgh and once from Edinburgh to Valencia. Here, the passenger count is based on departure and arrival.
Directional air traffic is when we calculate traveller demand that flows in one direction. For example, if a traveller searches for a return flight from Valencia to Edinburgh, they are counted once from Valencia to Edinburgh.
Non-Directional and Directional volumes help calculate trends more precisely, providing a clearer picture of what’s happening and where.
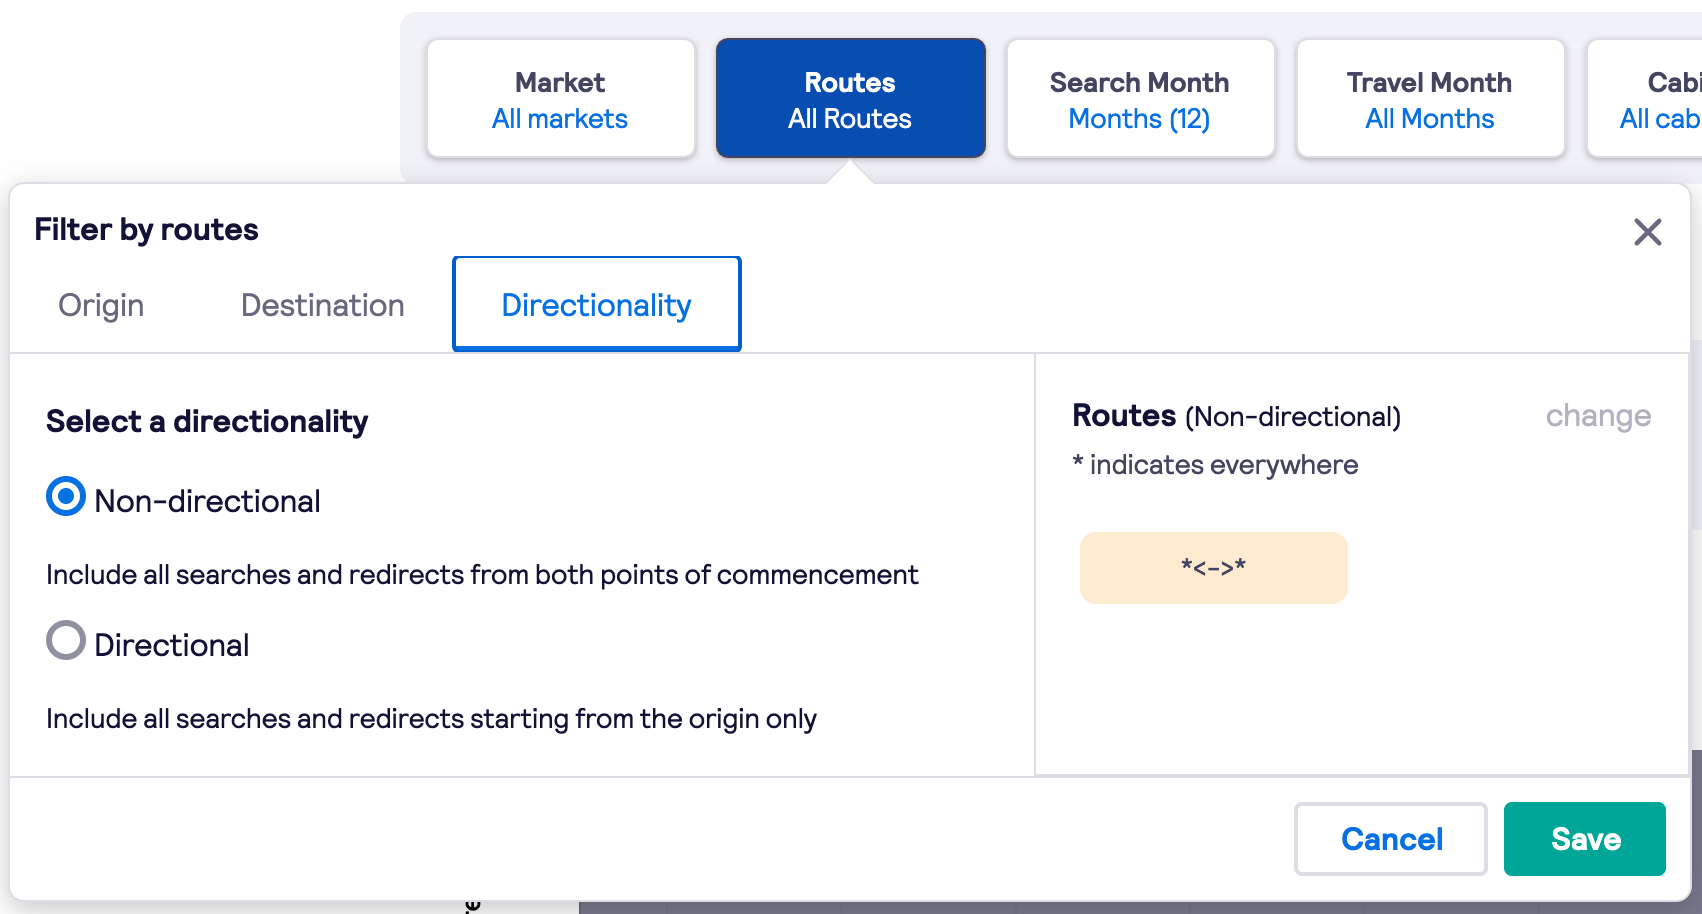
The directionality of the route is also represented by the double and single arrow representation in the right-hand side of the Routes filter.
 |
|
 |
Search period
The period when a traveller's search takes place.
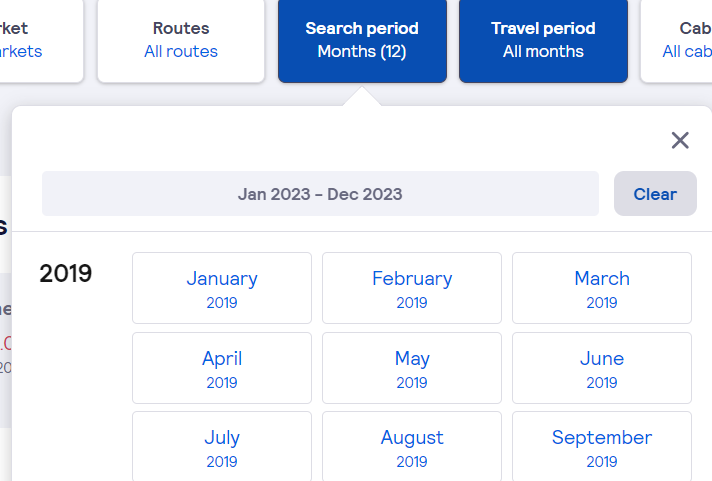
- Historical search months are included to the current date.
- By default, the module is updated for all 12 search months selected.
- Select one or multiple search months from the list by clicking the month buttons, these will appear dark blue once selected.
- Only continuous month selection is allowed. For example: if you click on Jan and June month buttons, Feb, Mar, Apr, and May will be auto-selected to show trends for those months.
- A single month selection e.g. May 2019 will display in the Search Month filter button as May 2019. If 2 months are selected then it will appear as Months(2).
- All months can be selected by clicking the Select all button and all months are cleared by clicking the Clear button.
- A handy indicator at the top of the filter displays a summary of your selection period, e.g. Jan 2019 - Jun 2019.
|
|
 |
Travel period
The period when a traveller's trip takes place.
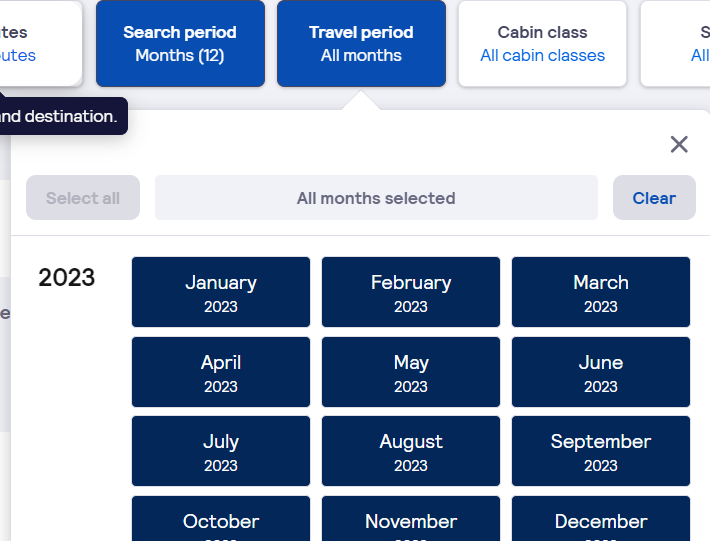
- Historical and future travel months, that were searched by travellers on Skyscanner will appear in the filter (including the current month).
- Select one or multiple search months from the list by clicking the month buttons, these will appear dark blue once selected.
- Only continuous month selection is allowed. For example: if you click on Jan and June month buttons, Feb, Mar, Apr, and May will be auto-selected to show trends for those months.
- A single month selection e.g. May 2020 will display in the Search Month filter button as May 2020. If 2 months are selected then it will appear as Months(2).
- All months can be selected by clicking the Select all button and all months are cleared by clicking the Clear button.
- A handy indicator at the top of the filter displays a summary of your selection period, e.g. Jan 2020 - Jun 2020.
|
|
|
Cabin class
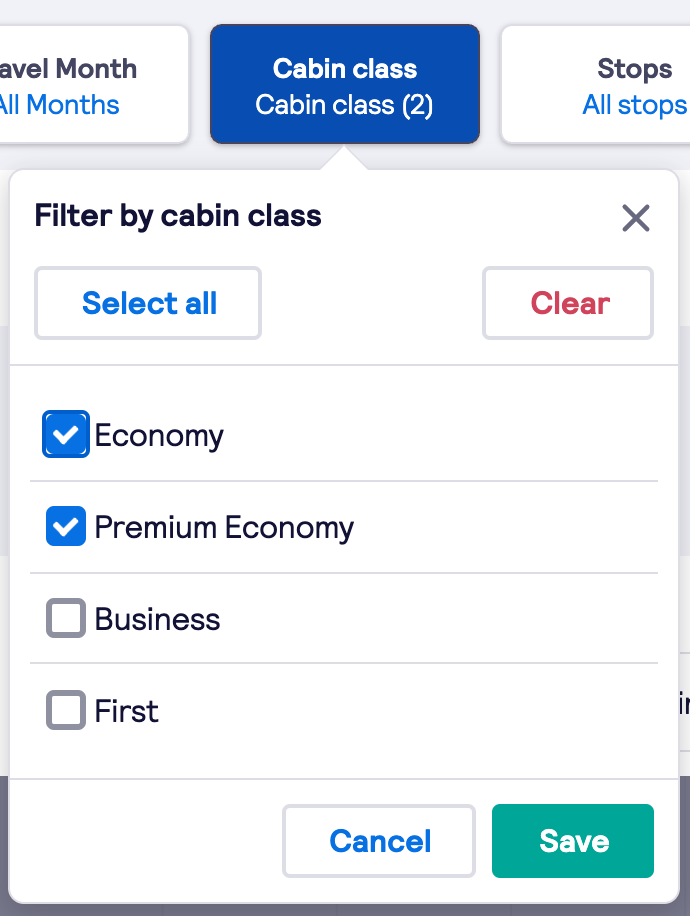
- Shows a drop-down list of cabin classes available on the flights serving the selected routes, e.g. Economy, Premium Economy, Business, First Class
- The interaction pattern is similar to the Markets filter.
|
|
 |
Stops
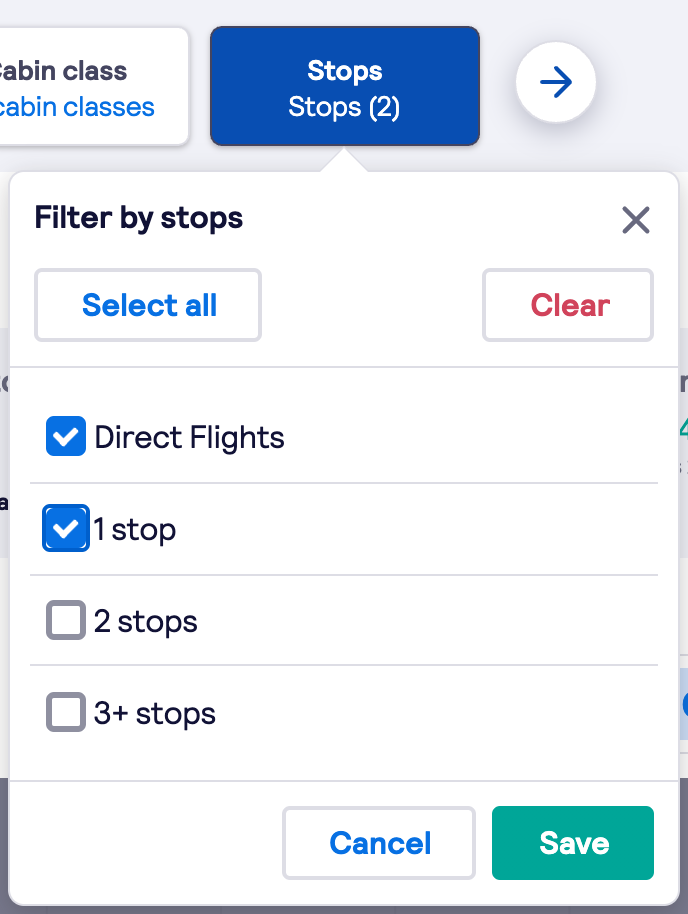
- Shows a drop-down list of stops options available on the selected routes, e.g. Direct flights, 1 stop, 2 stops.
- The interaction pattern is similar to the Markets filter.
|
|
 |
Day of week
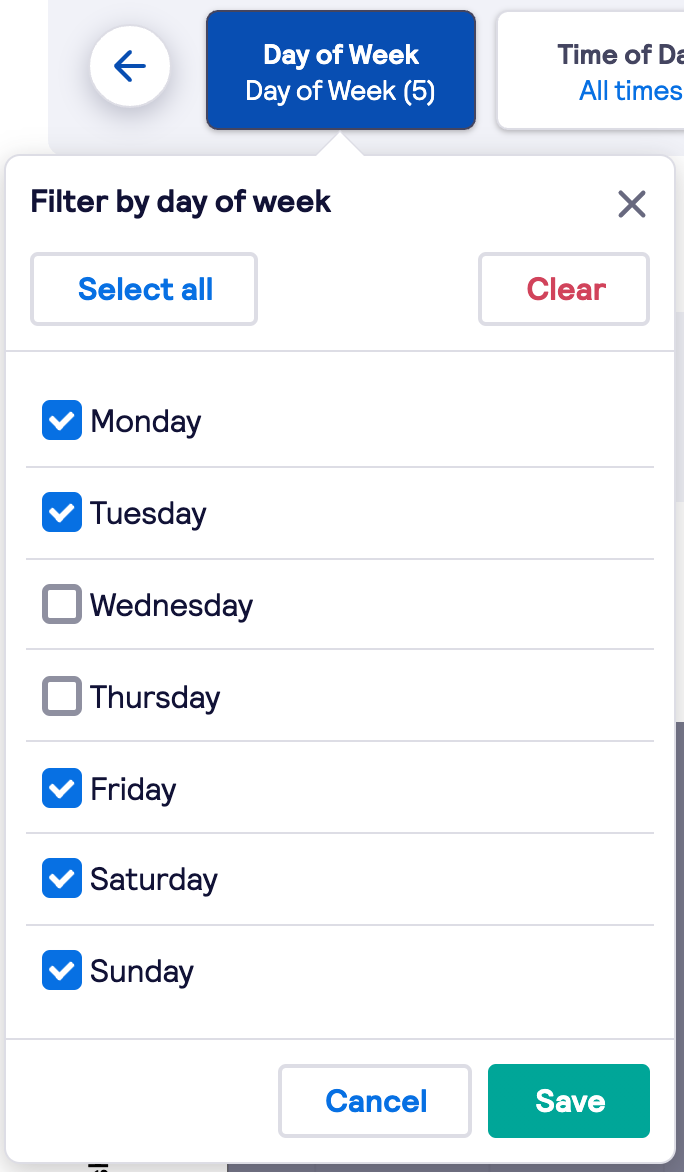
- Shows a drop-down list of day of week options from Monday to Sunday.
- The interaction pattern is similar to the Markets filter.
|
|
 |
Time of day
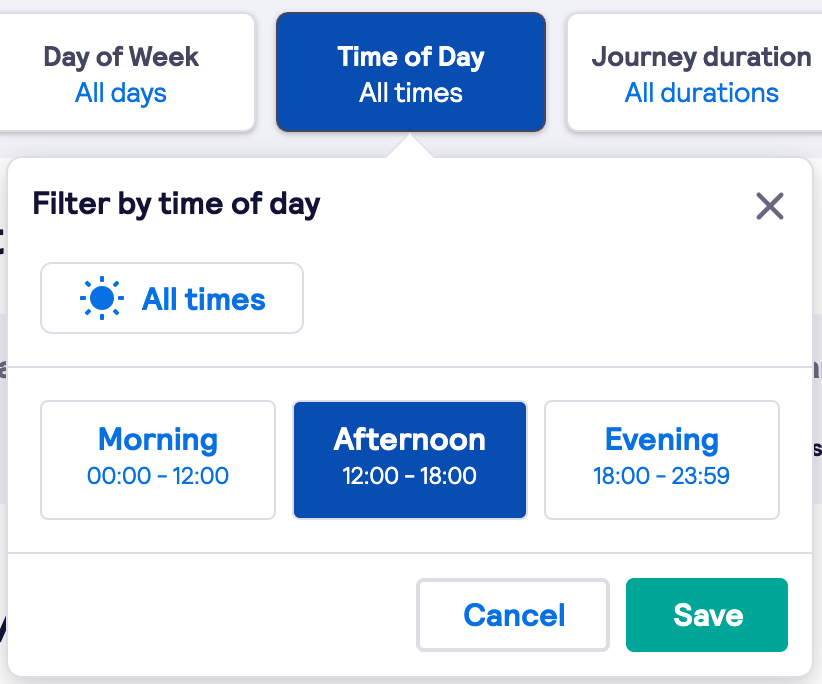
- Shows outbound and inbound flight times segmented by morning, afternoon and evening.
- By default, time of day will show data for all time segments both for outbound and inbound flights.
- Users can select a single option:
• All times
• Morning flights from 00:00-12:00 local departure time
• Afternoon from 12:00-1800 local departure time
• Evening from 18:00-23:59.
- Other interactions are similar to the Markets filter.
|
|
 |
Journey duration
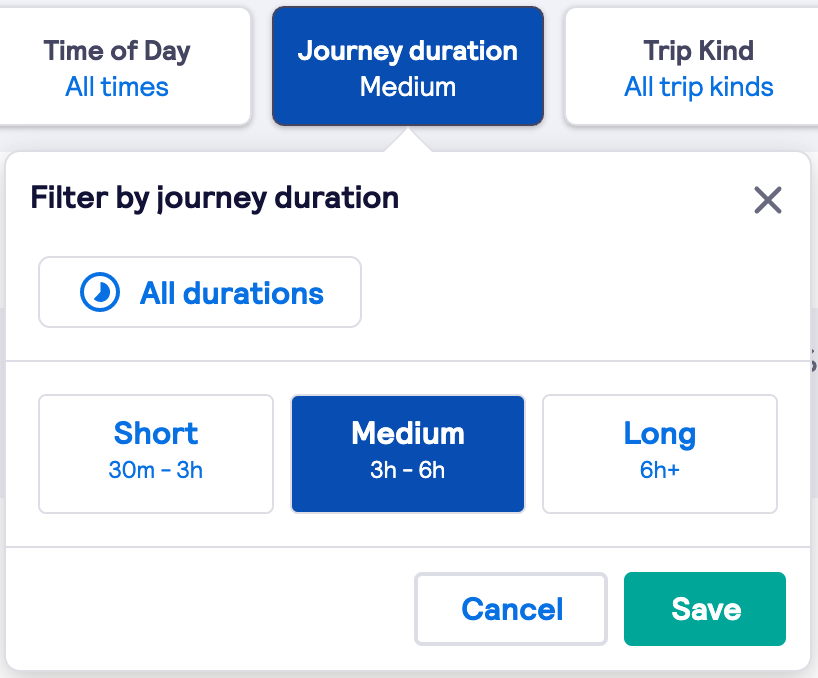
- Shows filter options for a total journey duration of the flight segmented by short, medium, long.
- By default, all journey durations option is selected.
- Users can select a single option:
• Short-haul flights duration is from 30min-3hrs
• Medium flights duration from 3hrs-6hrs
• Long flights duration >6hrs.
- Other interactions are similar to the Markets filter.
|
|
 |
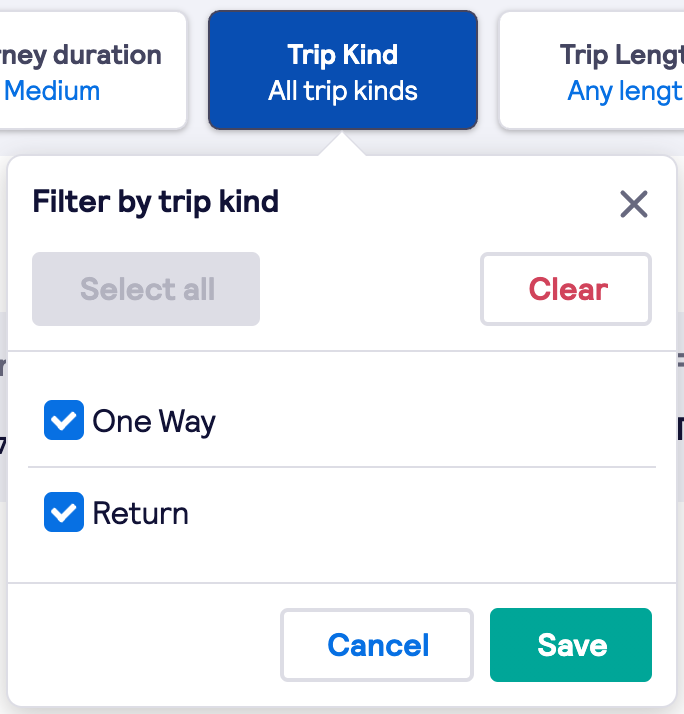
Trip kind
- Shows a drop-down list of trip types such as One Way, Return, Multicity.
- The interaction pattern is similar to the Markets filter.
|
|
 |
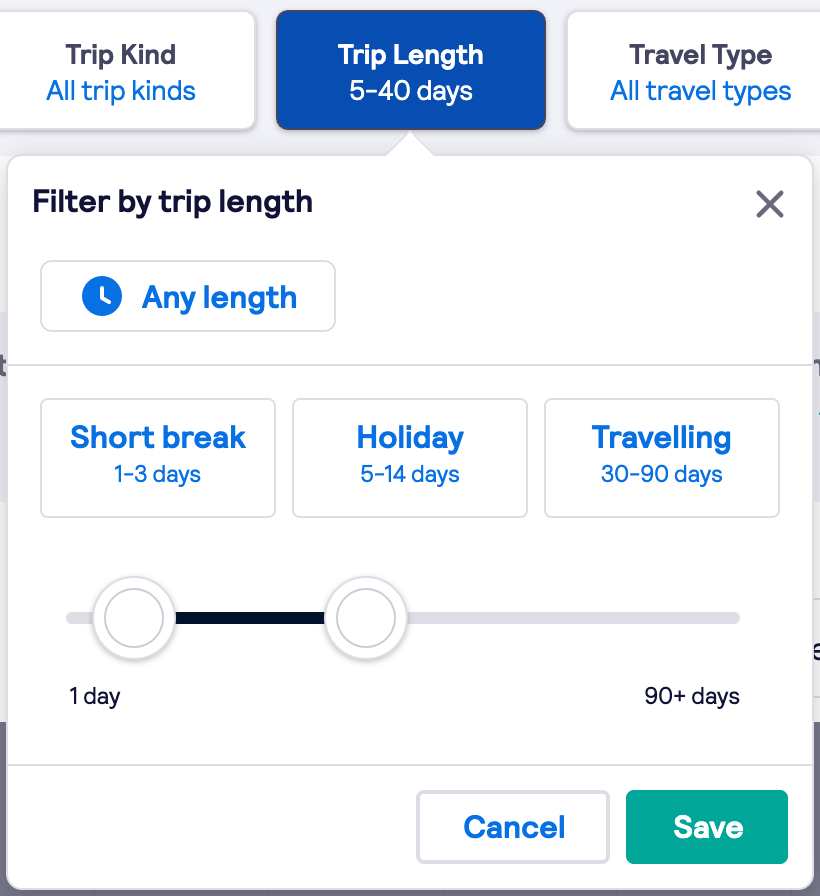
Trip length
- Shows the total length of the trip for return flights displayed in days.
- By default, all trip durations are selected.
- Users can select a single option:
• Short break 1-3days
• Holiday is 5-14days
• Travelling 30-90days.
- Other interactions are similar to the Markets filter.
|
|
 |
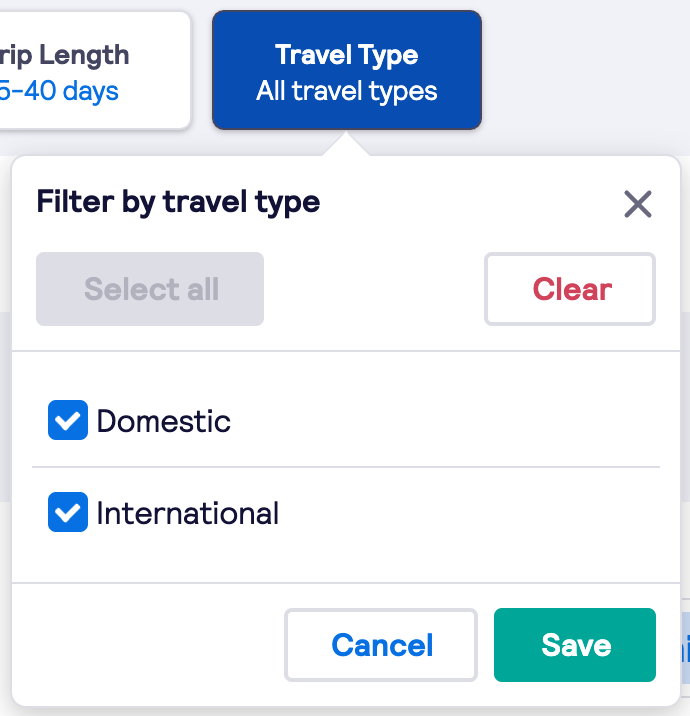
Travel type
- Shows a drop-down list of travel types such as Domestic and International.
- The interaction pattern is similar to the Markets filter.
|
|
 |
Key metrics
 |
Your average market share
- For airlines, this metric shows their average market share, observed over the selected search month period (last 12 months by default) for a given filter selection
- Vs 2019 (or Last year): Percentage points in average market share for a given filter selection compared to last year. Displays Increase in green font colour and decrease in red font colour.
Overall market size
- A total number of Redirects observed over the selected search month period (last 12 months by default) for a given filter selection.
- Vs 2019 (or Last year): Percentage Change in average market share for a given filter selection compared to last year. Displays Increase in green font colour and decrease in red font colour.
Competitors with a market share of over 10%
- A total number of airlines participating in the market (i.e. receiving redirects on Skyscanner)
- A number of airlines that have a market share over 10%.
Fastest-growing airline share
- The airline with the largest absolute market share increase observed over the selected period, compared to the same search period last year.
- Vs 2019 (or Last year): An arithmetical percentage points change in average market share for the fastest-growing airline. Displays Increase in green font colour and decrease in red font colour.
|
Airline market share trend
- Airline Market Share represents airlines redirect share trend observed over the selected Search Months period by selected Travel Months for a given filter selection
- Each data point showcases at most 5 selected airlines trends and the Other airlines share.
- A user can change selected airlines on the graph by clicking on a Customise button and selecting up to 5 airlines in a checkbox list.
- All unselected airlines from the Other airlines share.
- Shares on the chart are sorted by the average market share bottom to top with Other airlines being always at the top of the chart.
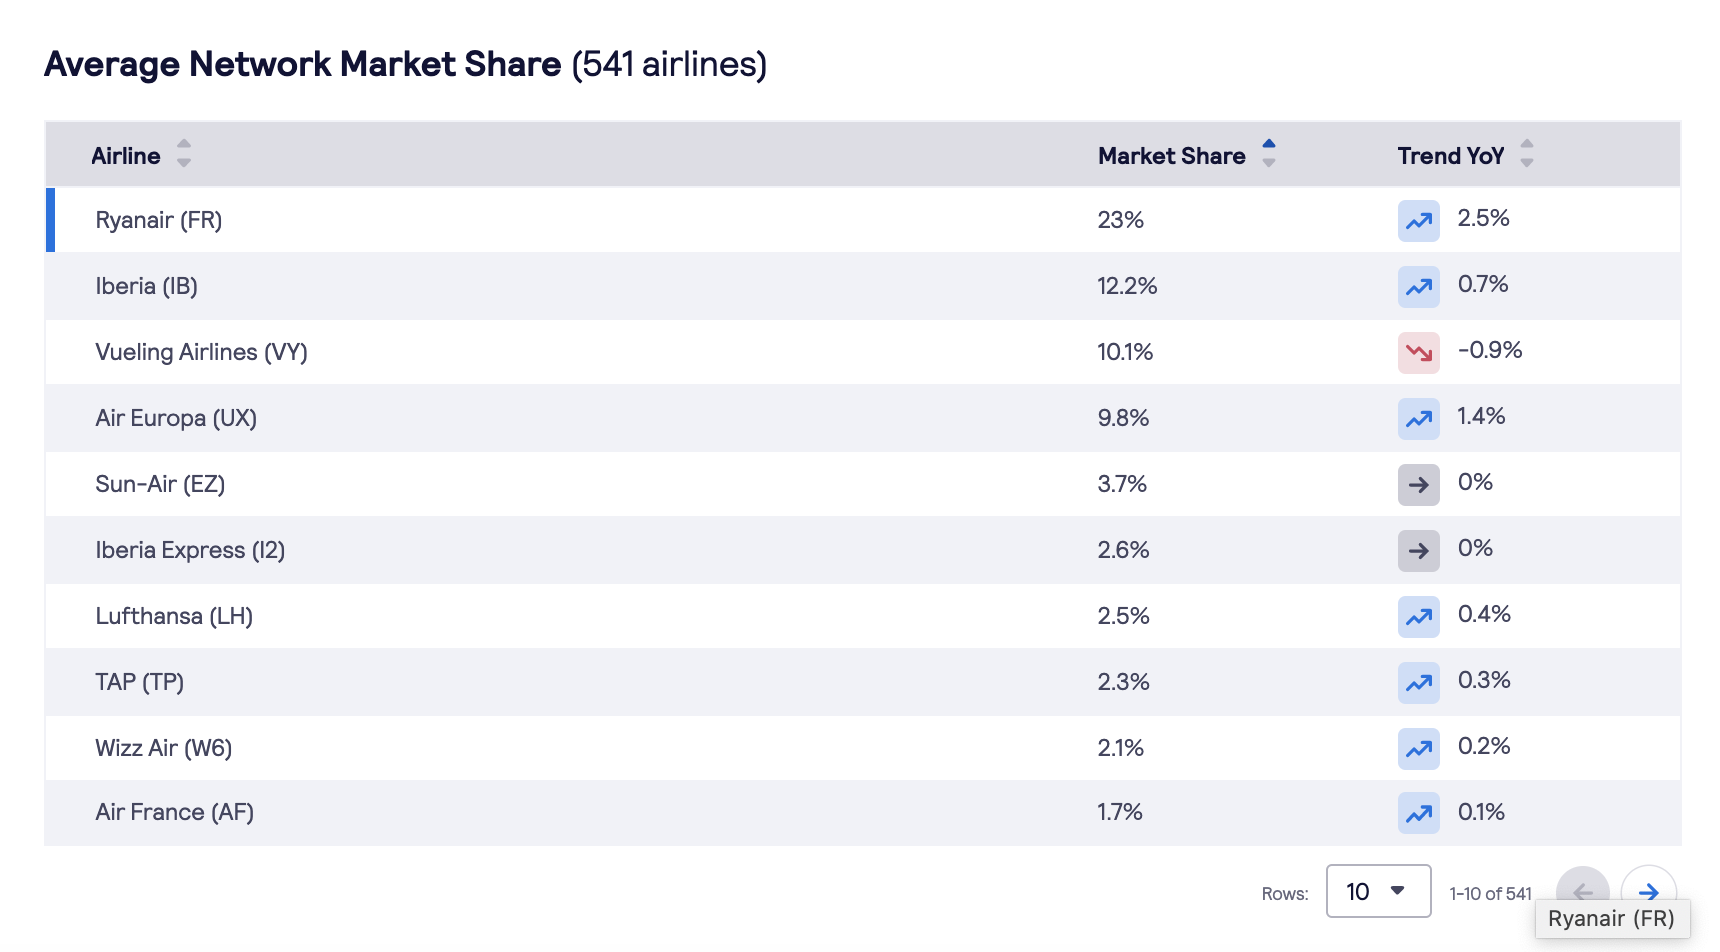
Average airline market share table
- The table displays the following data
- Airline name
- Market Share
- Average airline market share observed over the selected search period for a given filter selection
- Trend YoY
- Arithmetical percentage points change in average market share for a given airline comparing to the previous year.
- The change tolerance is 0.1 percentage points, i.e. a shift less than 0.1 percentage points is not considered as a trend change.
Export
| All Network Market Share module data (filter selection, key metrics, chart data and table data) can be exported in .xls format. |
|
 |
-